Wednesday, December 22, 2010

Oil - Natural Gas Cointegration - turning point?


Much has been written and said about the NG / CL relationship.  For most of 2009 pundits touted NG as historically underpriced relative to CL.  As always the reality is more complex.  Comparing a largely domestic USD commodity with an internationally traded commodity increasingly consumed by emerging markets has inherent risks.

More subtly, most commentators ignore the roll issues in both markets in making comparisons of relative value.  For a long / short convergence trade to make sense over any time frame of more than one month, the reality of dealing with a periodically expiring contract has to be addressed.

Recently I was experimenting with applying cointegration metrics to the NG & CL markets.  More can be found about cointegration elsewhere [http://en.wikipedia.org/wiki/Cointegration] but in a sentence cointegration measures the likelihood of convergence as opposed to correlation which measures the likelihood of comovement.  Convergence provides a more useful measure of potential profitability of a long/short trade.  In theory cointegration provides a useful filter against spurious correlations.
[Also for both a great exposition and elegant implementation in R, see: Pfaff, “Analysis of Integrated and Cointegrated Time Series in R”.]

So in order to test for cointegration you need a time series of the investable asset on both sides.  In the case of CL & NG, with monthly expirations, you need to create the time series of what a long or short futures contract return would look like including the monthly roll.

For simplicity I assumed roll on the penultimate date at the closing price.  This is easily achieved via the extremely liquid TAS market which is usually clears within a single tick of the closing price.

What is interesting is that over a reasonably long time frame, the two price series fail the test of cointegration.  A plot of the spread relationship can be seen here:
The huge run up and subsequent collapse in CL is even more apparent when compared with NG on a roll adjusted basis.

Even on a shorter YTD time frame the results are still not passing the ADF test for cointegration:
Why does the test fail so conclusively?  A closer examination of the return and price data yields the following interesting result.  Starting with yesterday’s closing price if we back-cast prices based on returns, including the roll yield we get the following chart:
What this shows is that to end up at yesterday’s gas price if $4.059 for example, gas would have been over $30 in mid 2008 once the roll return is incorporated.  Oil is a similar picture, to end up at yesterday’s settle of $89.92, oil would have to have been over $230 once the roll is accounted for.  [Investors in oil and gas ETFs like USO & UNG will be familiar with this picture.]

From a cointegration standpoint what is apparent is that once the roll yield is incorporated the two time series have continued to diverge on a roll adjusted basis.  This explains why no oil vs. gas long / short strategy has worked for some time.

This month looks like the first time that the winter prompt contract roll on NG is going to settle at less than a 10c discount… maybe this is the turning point for NG on a roll adjusted basis.

Good luck for 2011.

Wednesday, November 17, 2010

Its 9am, do you know what the traders are thinking?

Roll [1984] proposed a model for the bid-ask spread that was based on first-order serial correlation.  His empirical tests were based on daily and weekly frequency equity data, and based on the results he concluded there were informational inefficiencies (or that there was very short term non-stationarity in expected returns).
More recently this model has been applied to high frequency data by Hasbrouck in his comprehensive book “Empirical Market Microstructure” [Oxford University Press, 2007].  In it he proposes the Roll model as a means of distinguishing between “price components due to fundamental security value and those attributable to the market organization and trading process.”  In other words this could be a means of observing the flow of “private”  information into the market.

This blog posting analyzes recent natural gas futures prices to look for intraday fluctuations in the flow of private information using the Roll model.  It asks the question: are there particular times of the day when private information flows are greater?  Is there a way of observing real time, at short time scale, when private information is flowing into the market with a view to improving transactional activity.
To summarize the Roll model briefly it proposed that the bid-offer spread should be equal to 2 x sqrt(-cov).  Where cov is the serial covariance of price changes.

Data
The data source for this analysis is CME/NYMEX NG Oct-2010 futures contract market data.  The data is available on a per tick basis, however to calculate serial covariances and other time based measures, the data is sampled on a one second basis.  Other sampling approaches are possible.  This data is from 8/31/2010.
The NG futures market trades 23 ¼ hours per weekday electronically.  However the pit session is from 9am to 2:30pm and constitutes a time of significantly increased trading volume and liquidity.  Therefore it is interesting to observe this daily discontinuity in the electronic data as market volumes increase.  Do pit traded volumes add to the information in the marketplace?  Do pit traders have private information about the market?

Looking at the data from two minutes before the open to two minutes after the open we can observe this in action.  If we take this 4 minute window and calculate serial correlations with a 30 second lag then we have 3 ½ minutes of data or 210 data points for this example.  Looking at raw price changes in ticks we don’t see any obvious patterns.  The data is scattered around 0 as we would expect with some outliers representing big moves: 

If we move to the prices level itself, we see that prices increased significantly after the open:


Now, looking at the theoretical bid-offer spread:

We can see that immediately at the open, there was a significant flow of private information into the market although it was brief.  After 30 seconds, the serial covariance lookback window, we see that this has already dropped.  In other words, the private information that floor trading brought to the market on this day was short lived, even though prices continued to rise.
Since we have actual bid-offer spreads for this same time horizon we can calculate the ratio of the theoretical to the actual.  Actual bid-offer spreads are limited to a lower bound of 1 tick.  When we calculate the ratio we find that it is similar to the prior chart:
For part of the time that private information is coming to the market, the bid-offer spread gets wider to accommodate this as market participants take a wait to see approach to the market.

More generally it would be nice to know when this information flow is prevalent.  Hedgers or price takers in the market may be inclined to wait for private information to flow through the market.  At the same time proprietary strategies may attempt to get in front of this information flow.  In this example, taking the lead from the market and buying immediately based on the private information flow would have led to short term profits by the end of the 2 minute time window shown here.

Similar examples can be seen at other times of day and on other days.

So in conclusion, the flow of private information to the market can be measured; traders would do well to take heed of it.

Monday, October 18, 2010

The curious case of Oct-Jan NG spreads


The recent expiration of the Oct NG contract provided an opportunity to revisit analysis of the Oct-Jan spread.
Background
This spread is calculated (as all NG spreads are) based on the nearer price minus the further price.  For example on the last day the October contract traded this year (September 28), the prices were $3.837 and $4.342, so the spread settled at -$0.505.
Winter NG trades at a premium to summer due to the scarcity value of gas during the peak space heating season.  Gas is accumulated during the summer in seasonal storage which is depleted during winter.  This pattern is fairly predictable for a given weather forecast; a cold vs. warm winter has a significant impact on end of season inventory.  More about gas storage can be found here:
http://www.eia.doe.gov/pub/oil_gas/natural_gas/analysis_publications/storagebasics/storagebasics.html
What is interesting about Oct-Jan is that it provides a metric for this economic “scarcity rent” earned by storage in anticipation of the winter to come.  As winter approaches it provides a way of comparing gas here and now with gas at the time of peak usage (and presumably maximum rate of withdrawal from inventory).
As such it would seem intuitive that this premium was higher in years when storage was running below average and lower in years when storage is running above average.  For example if storage is filling earlier than usual, or at least is above the same level as this time last year, one might expect that winter gas will trade at less of a premium.
One problem with looking at this analysis across several years is that the outright level of gas prices has varied widely.  One approach this problem is to consider the spread in terms of its percentage premium to the October price itself.  Continuing the numerical example above, the spread settled at -.505/3.837 or 13%.  (For simplicity of discussion consider the negative of the premium.) In this way we can normalize the premium to the outright price level.

Premium vs storage level across time
If we consider the current level of storage compared with the same time last year, we get a rough metric for seasonally adjusted storage, and presumably market sentiment as to the scarcity rent that should be earned by gas supplied at times of peak demand.

Although it is difficult to see much of a pattern there is one clear message.  Greater levels of positive storage seem to be associated with greater premiums rather than the reverse as expected.  The correlation here is 0.51, so reasonably significant.
However it is possible that this is a “within year” effect.   Maybe with each year the spread moves in a way that is negatively correlated with storage, but from one year to the next we observe a positive relationship.
Although it is of questionable academic accuracy the following chart shows the average storage deviation from the prior year with the average spread premium. 

This correlation is 0.60.  Even ignoring 2005/06 winter due to post Hurricane Katrina market turbulence and 2008/09 due to the credit meltdown / financial crisis, a fitted line still has a significant positive slope.  Every 100 bcf of incremental storage leads to a 1% increase in the premium of the spread over the October price.
Hypotheses
What are some hypotheses that explain this unexpected result?  Why would traders place more of a percentage premium on winter gas in years when storage is at a higher level?
·         Anchoring: winter prices are a constant level; therefore storage excess must show up in a depressed spot / current price.
·         Seasonal elasticity of demand: buyers in winter know their options are limited, whereas at other times of the year buyers can use the inventory level to drive a harder bargain
·         Regional storage / national price: when regional storage has filled early, basis markets become offered as there is less capacity in regional markets to store.  This basis softening flows “upstream” to Henry Hub depressing spot & prompt markets while leaving winter prices unchanged.
Whatever the reason, this counter intuitive phenomenon does help explain why calendar spread trading can be a “Bermuda Triangle” for natural gas traders.

Tuesday, September 21, 2010

Oil - Equities correlation - trading opportunity or new normal?


Higher correlations between oil and equities has been widely discussed in the financial press.  Coinciding with the Global Financial Crisis [GFC], correlations in daily returns have risen from their historical +/-0.2 range to over 0.6.

Hypotheses for this change vary.  Some commentators believe this is evidence of ongoing disruption to markets from the GFC, suggesting that this relationship will revert to its historical range once the period of deleveraging has run its course.  Others believe it represents a “new normal” driven by the huge increase in commodity investment from index funds and ETFs.  Investor sentiment drives funds flow into and out of “risky” assets, both equities and commodities simultaneously, leading to the inevitable increase in correlations.

For most of history, oil prices were considered a countercyclical economic signal.  Higher prices for a factor of production led to fears of an inflationary spiral and potentially lower growth and equity valuations.  When the rolling correlation is calculated over a 5 year time frame, it has been consistently slightly negative except for a brief period in the run up to the 2003 invasion of Iraq, a period of significant volatility in both markets.


Starting in June-July 2008, the short term correlation turned at first very negative, as oil briefly ran up to its historical peak level of $145.29 even as the stock market was falling rapidly.  Then, as reality sank in, the oil market started to trend downwards; the period of high correlation set in.

Stat Arb trading models

Not surprisingly, this transition proved highly profitable for some classes of Stat Arb model.  Price movements were large and predictable in the context of equity price movements and the contemporaneous historical relationship.  Strategies which had made small gains for several years enjoyed outsized returns during the whole calendar 2008 period.

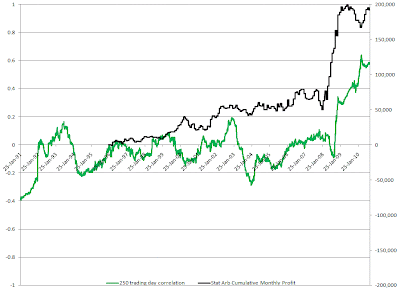
The chart below shows profitability of a generic directional stat arb model for long/short CL as a function of S&P % gain / loss with a 1-9 business day hold period, overlaid with the rolling 250 day correlation stats.


What is perhaps most striking about this chart is the fact that the stat arb model has not had cumulative profits since May 2009, even as correlation has moved higher.  This suggests that the relationship between oil and equities has reached a “new normal”.   

While higher correlation appears here to stay, the opportunities to profitably trade one against the other may be gone, at least for the short term.